
Warwick Rowell
SHADING WINDOWS IN SOUTH WEST WESTERN AUSTRALIA
This paper has been honed and reviewed to give the simplest outline of the essential knowledge needed to calculate the dimensions and location of window shading devices for retrofitting houses in SW Western Australia, using paper alone. The key document is the last page of this article. You can tear or print it off or you could photocopy it. Doing that now will enable you to understand it a bit better, as we explain the diagram later.
The page shows sun angles for 32 degrees south latitude; this is most appropriate for Perth and its surrounds. Diagrams for other latitudes are available from Mazria, E. (1979). Passive Solar Energy Book, Rodale Press.
Most people find that the hardest bit of the diagram to understand is the long horizontal axis.
Pick up the page with the diagram on it, and stand that sheet up so the long bottom axis of the graph is closest to the surface the sheet is on. Now orient the paper so the north arrow is to your north (approximately – this is only to give you the idea: we’ll give you a more accurate method for finding north later). Then curve the paper towards you so it forms two thirds, maybe three quarters, of a vertical cylinder. When you look at the inside of the cylinder, on the left you will see the West marker; on the right will be the East marker. This should give you the feel for the fact that on a flat page, the horizontal axis of the graph has just flattened the two thirds of the circle which shows the BEARING (or AZIMUTH) of the sun from the building you are considering.
Now we can look at the vertical axis on the diagram. This measures the height of the sun above the horizon, its DECLINATION. Look at the peak of the top curved line. You can see that at 32 degrees south latitude the sun doesn’t get higher than 82 degrees, and this only happens on December 21, the date of the summer solstice. This is because 32S is about eight degrees more southerly than the Tropic of Capricorn, at 23.5S, where the sun would be directly overhead (90o) at local midday. At any other time of the year, the sun is lower than 82 degrees in the sky at midday, and through the day as well.
Looking at the bottom curved line, you can see that in the middle of winter, at June 21, the sun only gets to 33 degrees above the horizon. If we look along the curved line for a particular date, we can see approximately what time the sun rises, its DECLINATION – how high it is in the sky – at any time, and at what AZIMUTH. Have a go yourself a few times, starting with right now; extrapolate between the rectangles for the time now, and today’s date, and check that the diagram accurately informs you as to the location of the sun.
The upper curved line, the graph for Dec 21, shows us that (from right to left):
A The sun rises at about 5 am.
B At 9 am, the sun is due east, about 47 degrees above the horizon.
C At 12 noon it is 82 degrees above the horizon
D At 3 pm it is due west, about 47 degrees above the horizon.
E The sun sets at about 7 pm.
This means that in mid-summer, your south wall could get up to eight hours of sunlight – from 5 until 9, and then 3 until 7…
This graph that gives us the information we need to control the sun and shade into our windows, and onto our walls. Let’s work through a simple exercise.
Say you want to shade a north-facing window from the hot sun between 10 am and 2 pm, from October 21 to Feb 21.
To make things simple, the dates are on the same curve, and the times are both two hours from noon. In any other case, you would have to extrapolate between the curves, and/or the time lines, and, if your dates and times weren’t symmetrical, take the appropriate declination and azimuth.
For this case, the graph shows a DECLINATION of 55 degrees. That is, an eave, or roof, or other shade structure, temporary or permanent, would have to form an angle of 35 degrees (90 – 55) with the base of the window or door to keep all the sun out. See the diagram below.
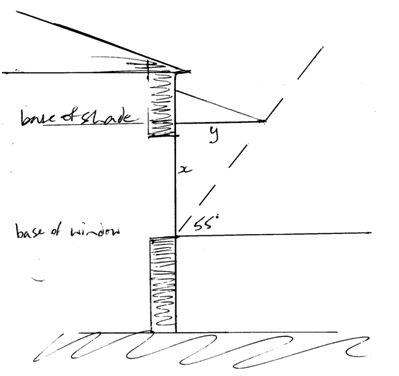
Now you need a little trigonometry: Tan 35 is 0.7002. So the calculation we need to do is opp = 0.7002adj. This means that to totally shade the window through the times we want, the shading device must come out from the wall (the side opposite to the relevant angle) 0.7002 times the height difference between the bottom of the window and the bottom of the shading device (the length of the side adjacent to the angle).
The other point that is important to grasp is that if we installed our shading device over just the length of the window, we would not achieve the result we want. We must extend the shading device over a larger distance either side, because the sun is not coming from due north – perpendicular to our E-W window – all the time. We must allow for the sun’s AZIMUTH.
The information we need to work out how much we need to extend the shading device is given to us on the bottom axis of the graph.
If we drop down from the point on the curve for 10am on October 21, we find that the AZIMUTH of the sun is 60 degrees; closer to east than to north. Looking down on the window from above (see the plan diagram below), we can see how wide an eave or sunshade device we need to keep the sun out of that window. Now we see the true advantage of roof eaves and verandahs; their single structure can provide shade for many windows at once.

To determine the relationship between the depth of the shading device from the wall, and the extra length needed, we head back to the trigonometry tables. Tan (90 – 60) = Tan 30, which is 0.5774. Tan is the ratio between the length of the opposite side over the adjacent side, so the length required is the depth divided by 0.5774. If we need a shading device 1m deep, then it needs to be quite long; the window width, then an extra 1.79m (1m/0.5774) at each end, to keep the sun out from October 21 to February 21.
It is worth working through a couple of examples of your own, to get to understand the huge amount of useful information in this diagram, with some simple trigonometry.
Now you have a grasp of the fundamentals, it is possible to understand more complicated situations, even when the detailed calculations are done for you.
Check out the web-site http://www.susdesign.com/overhang_annual/. This is the best web-site I have found for sun and shadow analysis – so far! If you have found another that is as good or better, please let me know, and we’ll pass it on to our members. Have a play on this interactive site. One of the really great things it gives you is the ability to “do the sums” for windows and walls that are other than due North, and to see the effects on shade, light and heat of changes to orientation that might be beneficial in terms of capturing breezes, or that reflect the reality of the orientation of your house.
To find the orientation of your house, you need to find out how far it is from facing due north; its ASPECT. The easiest way to determine the orientation or aspect of your house or wall or window is with a compass, remembering that true north is not the same as compass north. In SW Western Australia it only varies by 2 to 4 degrees… If you don’t have a compass, or you don’t know the VARIATION – the difference between compass and true north – you need to find your longitude; the number of degrees east (or west) of the north-south line that goes through Greenwich, in England, which is called the prime meridian.
Local noon is the time when the sun is highest in the sky for your location. When the time in this time zone is 1200 – 12 midday – the sun is highest in the sky only at 120E because 120E is the standard meridian for this time zone. In the southwest, your longitude will be something between 115E and 120E. For every degree you are west of the standard meridian, you need to add four minutes to determine the standard time of your local noon. At Yallingup – 115E – local noon is 1220. Not many of you will be further west than I am, so at 1220 or the earlier time you calculate, go outside, find a unobtrusive shadowline on the floor and mark it with a permanent marker. That is due north.
Measuring the angle between the shadow line and the edge of the slab, or whatever, gives you the ASPECT you need. It is okay if it is within two or three degrees either way. If you want to play, you could do the lines for each hour before or after your local noon; If our local noon was at 1204, draw the lines of the shadows at 1004, 1104, 1304, 1404. If your local noon was at 1208, draw the line when the time is 1008, 1108, etc. You could confirm the ALTITUDE curve (or determine your local noon if you do not know your longitude), by drawing in the shadow of say the balustrade of a verandah for each hour. The closest line to the edge of the verandah will occur at your local noon, and the others will be further away. Checking that your curve matches the diagram would be easiest on the 21st of a month, but extrapolation is not too hard.
Using the other article Surveying without instruments, you could sketch in on a copy of this diagram the AZIMUTH and ELEVATION of significant trees and buildings that might shade your house or solar panels, and then work out design strategies to better manage solar impacts.

If you find you understand all this, or you want to “have a go” electronically, there are a range of options:
If you use Google’s Sketchup for your plans, then shading and sun access information is available as an option within the software.
There is even a phone app: http://www.solarpowerportal.co.uk/martins_blog/sun_path_diagrams_and_shade_lines_2356
An interactive analysis, with its example based on Perth, is
http://andrewmarsh.com/blog/2010/01/04/solar-position-and-sun-path
Other websites are:
https://www.educate-sustainability.eu/portal/content/sunpath-diagrams
http://wiki.naturalfrequency.com/wiki/Sun_Path_Diagram
If you come across better sites, or other sources of diagrams, please let me know, so I can improve this paper. Many thanks.